How to read and communicate about an income statement
These essential snapshots of an organizations’ financial health (sometimes called profit and loss or P&L statements) are handy tools for communicators—if they know how to decipher them.

[Editor’s Note: This is an excerpt from “Business Acumen for Strategic Communicators: A Primer.” You can purchase the book here and Ragan/PR Daily readers receive a 30% discount with the code BUSINESS30.]
The income statement, also referred to as a profit and loss statement (P&L), shows how much revenue or sales an organization has generated over a certain time period and, after subtracting expenses or costs, shows whether the organization has made or lost money (i.e., produced net income or a net loss) for this time period, such as a quarter or a full year. Further, this statement shows whether these figures, such as profit or loss, have grown or declined compared to the prior comparison period included on the statement.
Even with GAAP standards, the titles and terms included on an income statement may vary from organization to organization and industry to industry. This said, the major categories and general contents included within an income statement and other types of financial statements remain similar and fairly consistent.
To walk through how to read an income statement and a balance sheet, the annual financials of Alphabet, Inc., the parent company of Google, will be used. A Fortune 20 company, Alphabet is widely regarded as one of the world’s most powerful corporations, controlling an estimated seven out of every ten dollars spent in the digital search advertising market in the United States. Globally, there are estimates that Google has an approximately 40% market share of all online advertising dollars.
Revenues
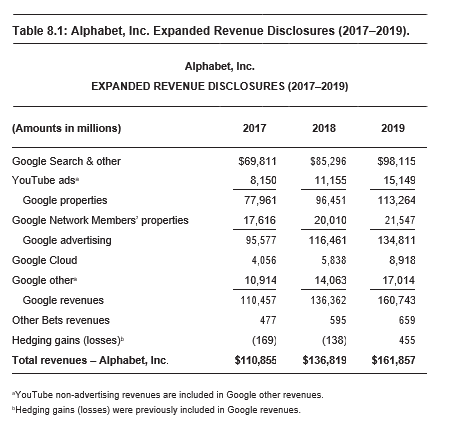
Revenues, also known as sales, is found at the top of the income statement. As such, revenue is often referred to as “the top line.” As shown in Table 8.1, for fiscal 2019, Alphabet reported total revenues of nearly $162 billion, an increase of 18% from the prior year. Organizations may choose to break out revenue into multiple categories on the income statement and/or they may choose to provide supplemental financial information in another table.
In the case of Alphabet, to provide better visibility into the performance of its various revenue streams, in 2020 the company expanded its revenue disclosures. As shown in Table 8.2, while Alphabet is making progress in diversifying its revenue streams, nearly $135 billion of its fiscal 2019 revenue, or more than 83% of its total revenue, was associated with online ads in some form. Alphabet generated nearly $26 billion in non-advertising revenue during fiscal 2019 from its Google Cloud Platform, such as G Suite tools, and Google Other businesses segment, made up of hardware sales, Google Play app purchases and non-advertising YouTube revenue. As a rule of thumb, financial executives and investors generally don’t want to see an organization too overly reliant on a particular revenue stream, customer or operating segment.


Cost of goods sold
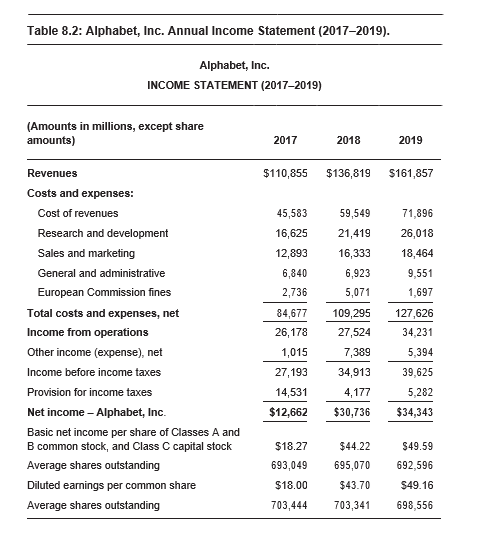
Cost of goods sold, also known as simply COGS, is a line or several lines found directly under the revenue line on the income statement. COGS lists the direct costs that go into producing an organization’s products or services and generating the resulting revenues. For a business that produces physical products, the expenses related to labor and the raw materials used to manufacture a product would be found under COGS. For a more digital product-based company like Alphabet, COGS include search traffic acquisition costs, content acquisition and licensing expenses, and expenses related to its data centers and other operations. COGS may be listed under a related term, such as cost of revenue, as is the case with Alphabet. Cost of revenue for Alphabet in fiscal 2019 totaled nearly $72 billion.
General and administrative expenses
General and administrative expenses, also known as G&A, is a line (or several lines) located below the COGS line (or lines) on the income statement. Sometimes this line or lines will be presented as sales, general and administrative (called “SG&A”) on the income statement. Whichever label is used, G&A and SG&A encompass the costs that indirectly contribute to the production and sale of the product or service and the resulting revenue generation. Typical expenses included in G&A or SG&A include items like sales, marketing and public relations (PR) spending; research and development (R&D); compensation of headquarters personnel; and other associated “overhead” that does not go directly into producing the product or service.
In the case of Alphabet, to provide more granularity, the company chooses to break out expenses associated with G&A into four different lines on the income statement rather than just one. As shown in Table 8.1, for fiscal 2019, Alphabet spent $26 billion on R&D, more than $18 billion on sales and mar- keting, approximately $9.5 billion on G&A, and approximately $1.7 billion on European Commission fines. These expense lines totaled $55.7 billion. The G&A line for Alphabet specifically includes compensation and facilities-related expenses for some employees, depreciation expenses, equipment- related expenses, legal-related expenses and professional services related fees.
Operating income
Operating income, which also may be labeled as income from operations or operating profit, is a line on the income statement that is found directly below the total costs and expenses line. The operating income line shows how much money the organization made or lost after it takes into account all direct costs (i.e., COGS) and indirect costs (i.e., G&A expenses) but before the organization pays any taxes and before it pays any interest expenses related to borrowings (and/or generates any non-operating income, such as from investment gains). For fiscal 2019, Alphabet reported income from operations of $34.2 billion, an increase of approximately 24% from the prior year.
Net income
The literal “bottom line,” the net income line is at the bottom of the income statement. The double underline in tables found under the net income figure signals a grand total. Net income may also be labeled as net earnings or a related term. This crucial line on the income statement shows how much money the organization made or lost after every revenue and expense item (both operating and non-operating items) have been taken into account. For fiscal 2019, Alphabet reported net income of $34.3 billion, an increase of nearly 12% from the prior year.
Matt Ragas is an associate professor of public relations and corporate communications at DePaul University. Ron Culp is the professional director of the graduate PR and advertising program at DePaul University.


